
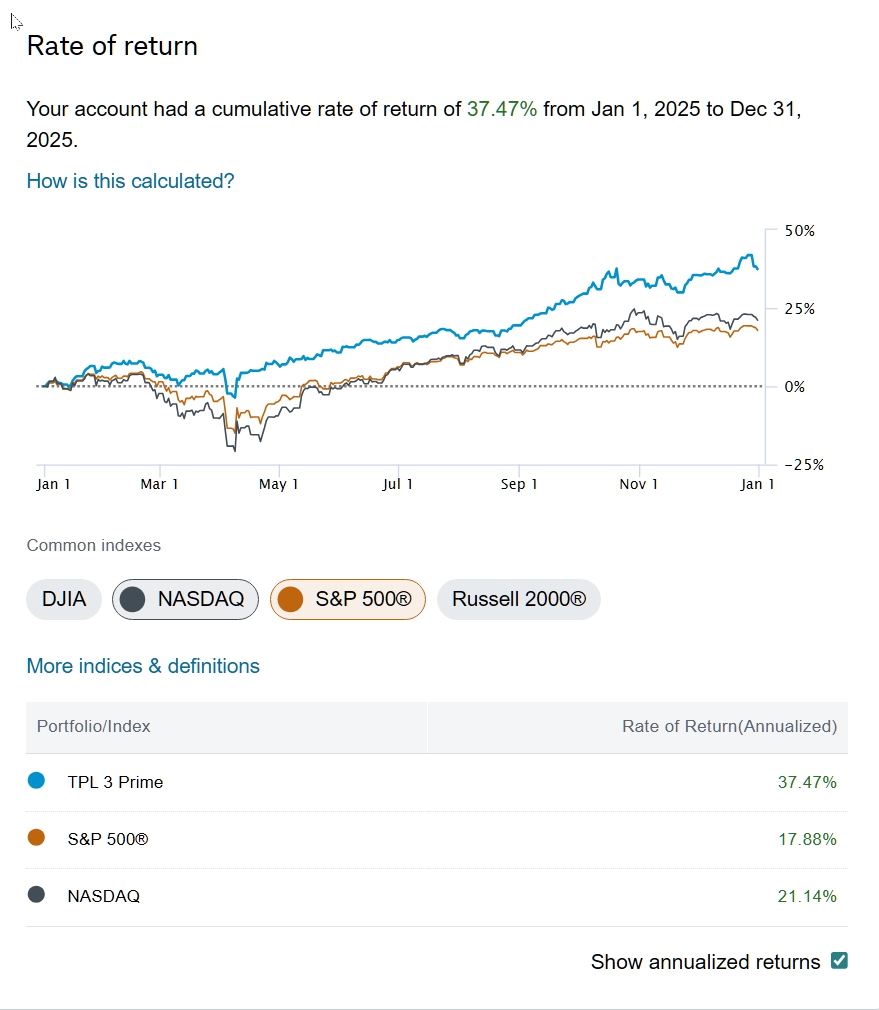
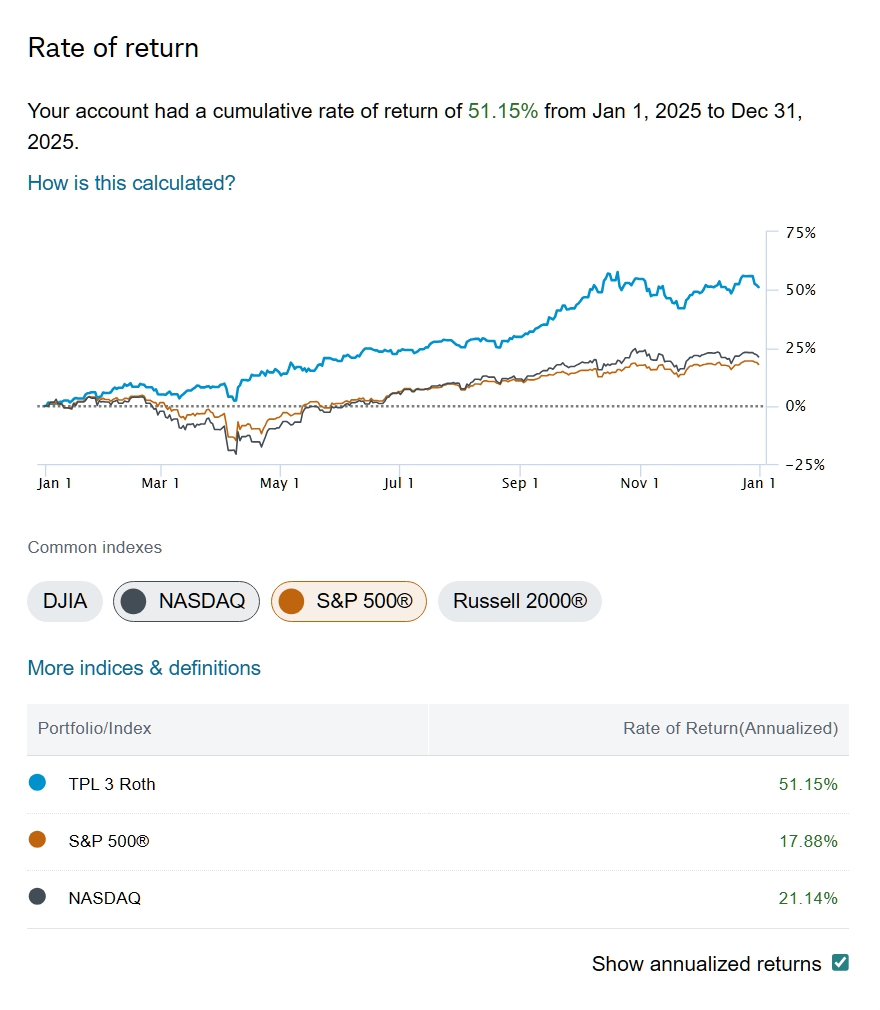
These are the 5 portfolios that I am able to view using the “Portfolio Performance” tab at Schwab. The algo behind this tab calculates the performance of a portfolio, regardless of contributions or withdrawals, buys or sells. Showing you the true performance of your portfolio including dividends. My “Tables & Charts” will differ from these performance stats. The tables and charts can only display a static portfolio over a given time frame, while a live portfolio may have buys and sells that are done for other reasons. Click to expand.

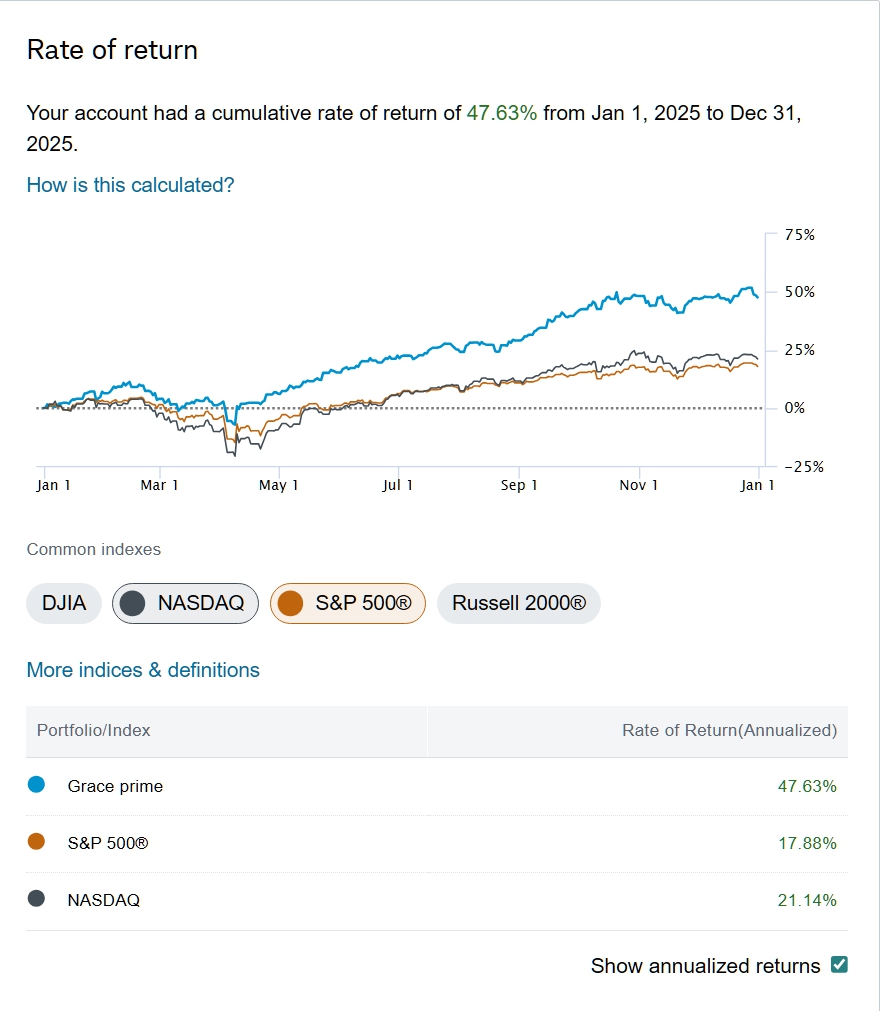
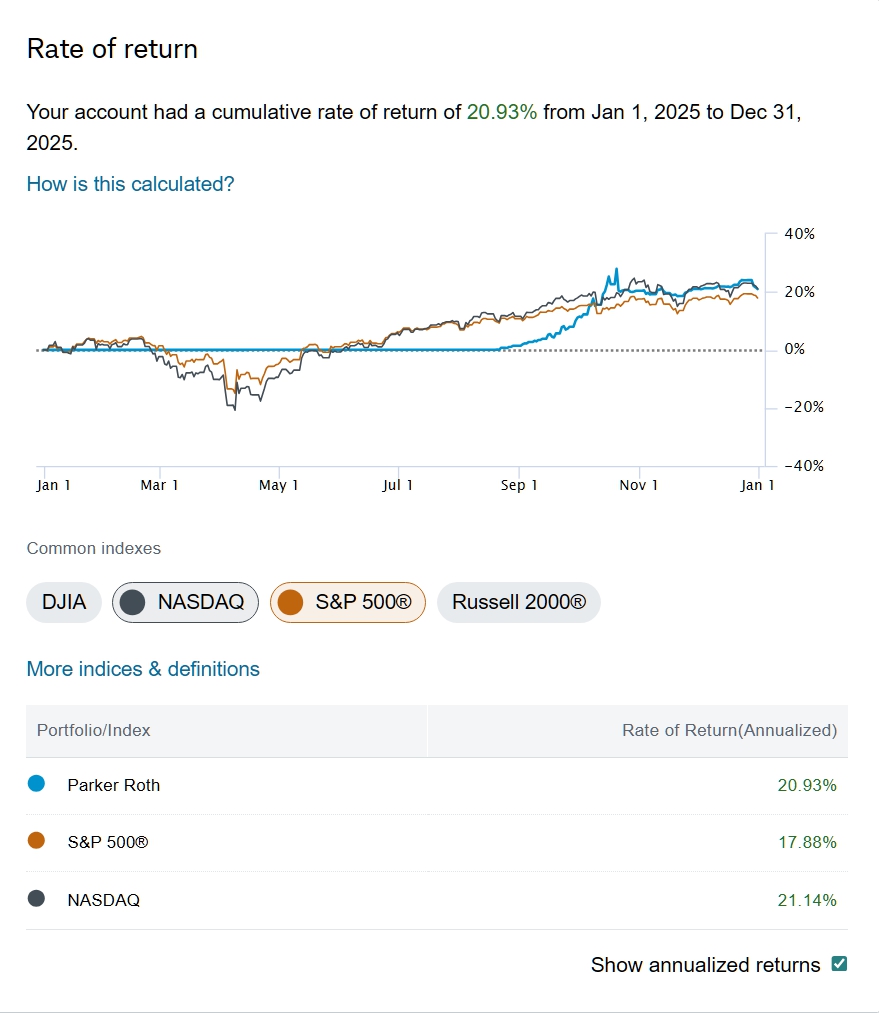
***Parker’s Roth is a 5 month run. ** Graces’ prime account will not calculate for some reason.