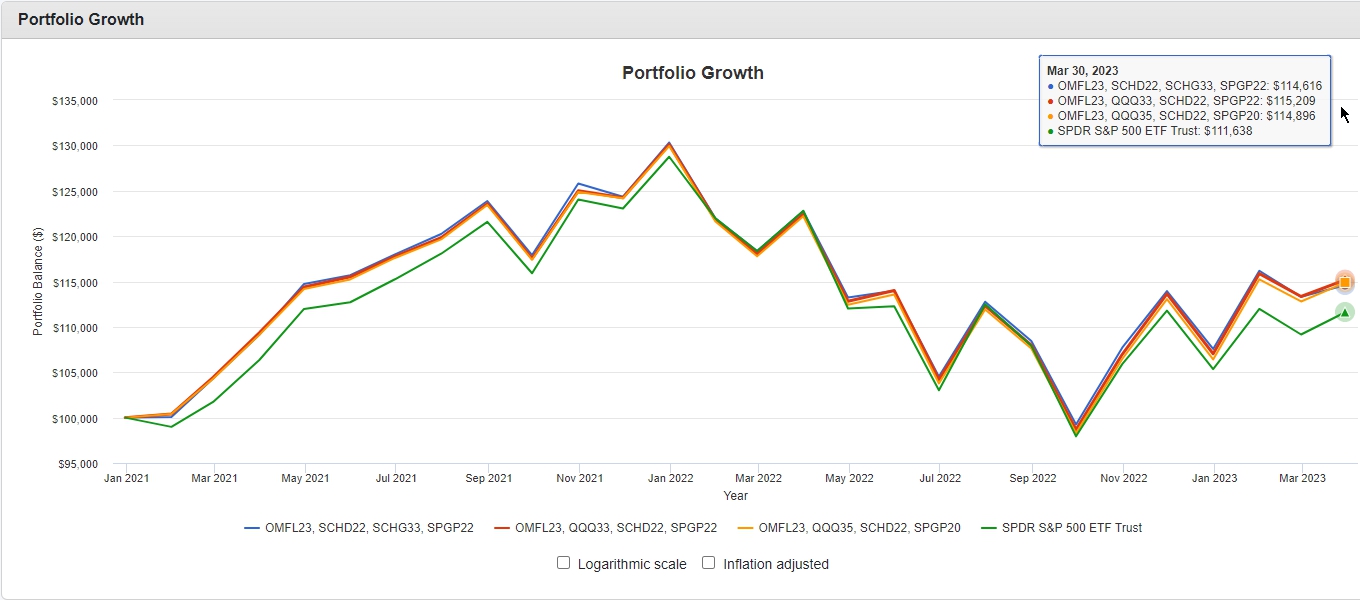
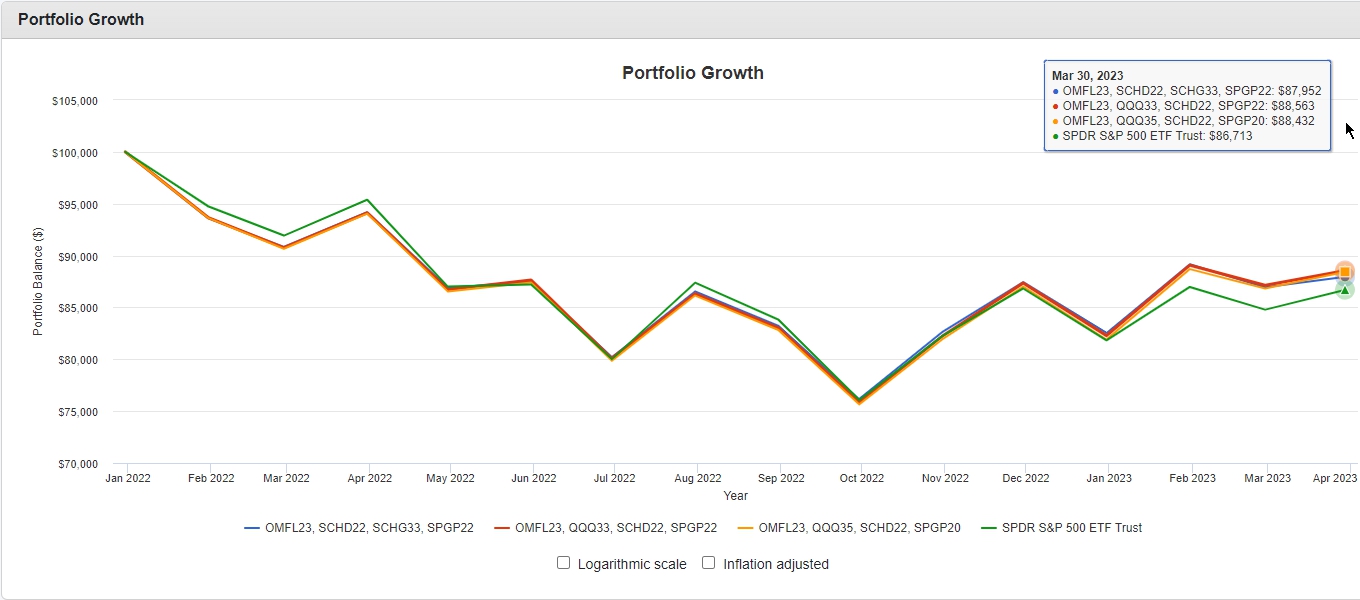
On this page we test 5 model portfolios using different allocations of OMFL, QQQ, SCHD, SCHG, SPGP. The Portfolio Visualizer only facilitates the testing of 3 models at one time. So there are 2 sections. Section 1 tests the Conservative, Medium and Moderate portfolios. While section 2 tests the Moderate, Aggressive and Aggressive+. Using the Portfolio Optimizer we can visualize the performance of various models over time. In the linked PDF reports I include the full data set from the tests. Unfortunately OMFL has only been around since November of 2017, so this limits our portfolio testing to around 5 years. The testing parameters are set to reinvest dividends and to rebalance annually. For simplicity the percentage allocation follows the ETF symbol. The table below shows 5 portfolios with differing allocations, and risk increasing in descending order.
| Model Portfolio | Risk profile | Age group |
| OMFL 23%, SCHD 33%, SCHG 22%, SPGP 22% | Conservative | 50 – 90 |
| OMFL 25%, SCHD 25%, SCHG 25%, SPGP 25% | Medium | 40 – 70 |
| OMFL 23%, SCHD 22%, SCHG 33%, SPGP 22% | Moderate | 30 – 70 |
| OMFL 23%, QQQ 33%, SCHD 22%, SPGP 22% | Aggressive | 20 – 50 |
| OMFL 23%, QQQ 35%, SCHD 22%, SPGP 20% | Aggressive+ | 20 – 40 |
Our volatile market conditions the last several years provide a better testing environment than a market that is trending in one direction during the entire time span. These charts are not as precise as the single stock backtesting charts from Yahoo, as the data points charted are monthly, rather than daily, but they offer robust data. There are links to the full PDF reports, below each chart. Each chart in this section shows the Conservative, Medium, and Moderate model portfolios over 3 different time spans.
Click on the charts to expand. Click on right/left side of full chart or use keyboard to navigate through the 6 charts.
Section One
The times spans used are as follows.
- OMFL, SCHD, SCHG, SPGP – 2017 to Present
- OMFL, SCHD, SCHG, SPGP – 2021 to Present
- OMFL, SCHD, SCHG, SPGP – 2022 to Present
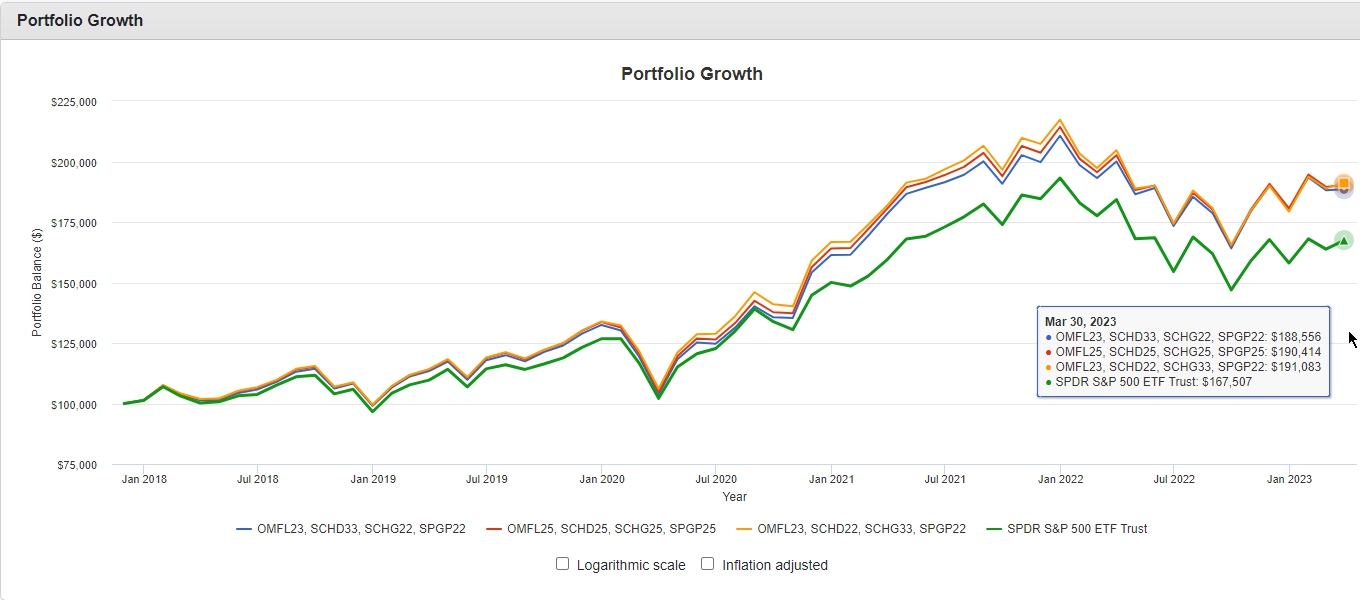
Link to full PDF report
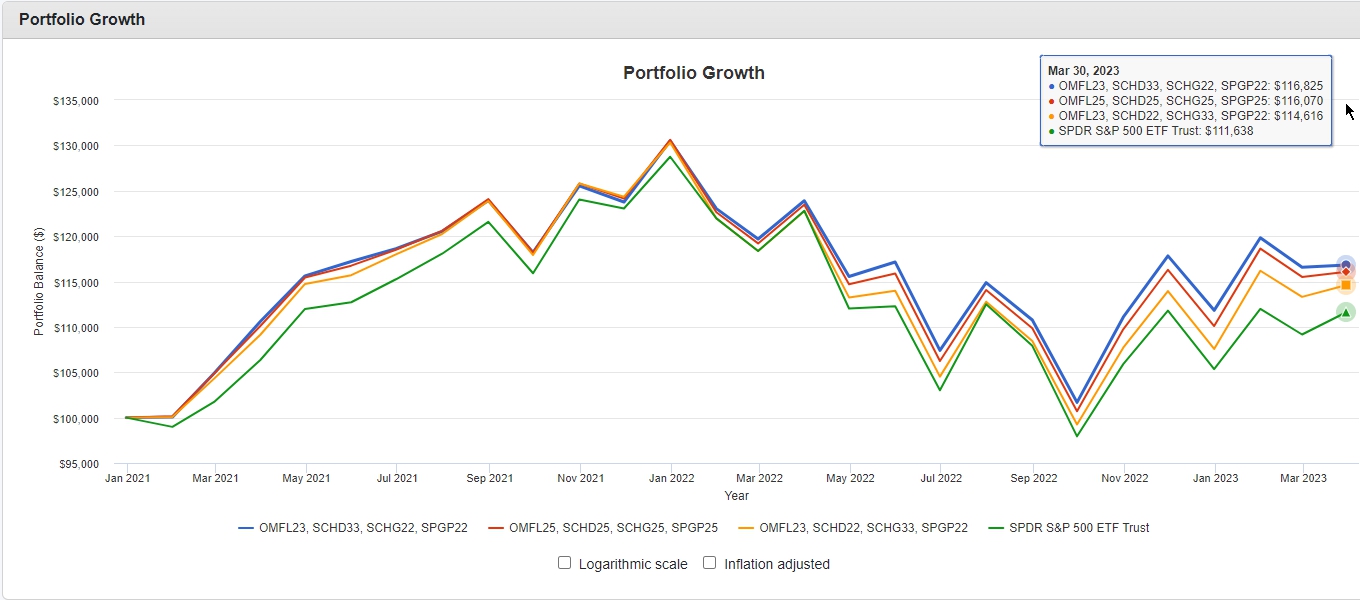
Link to full PDF report
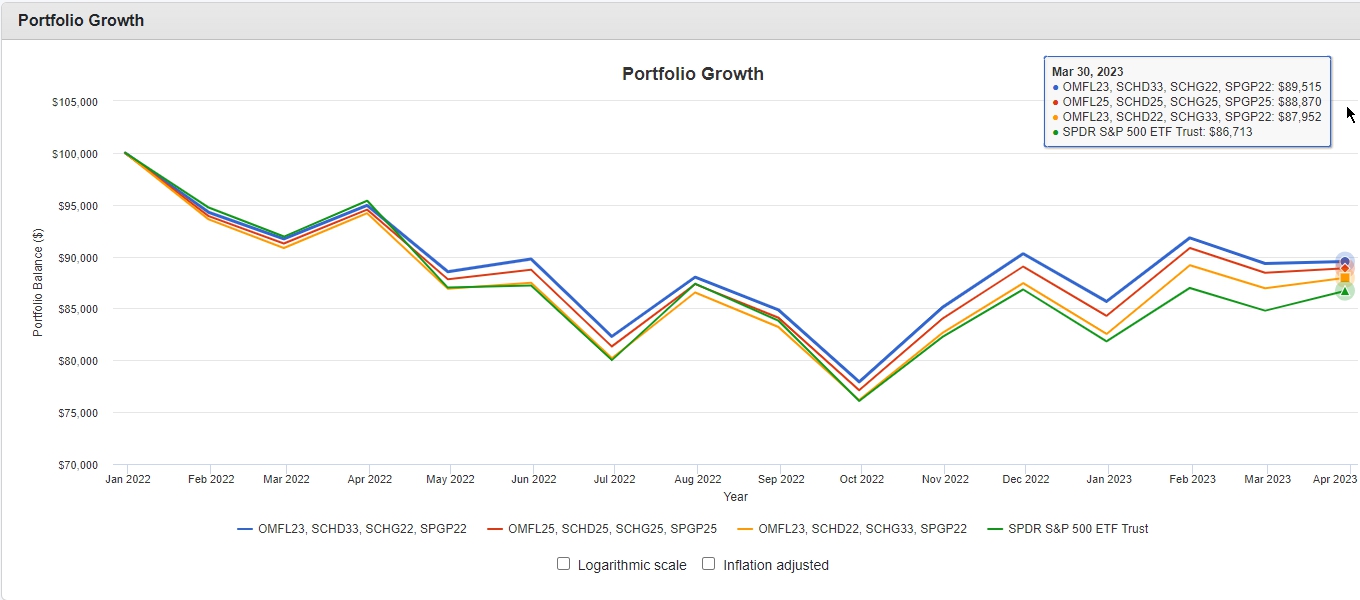
Link to full PDF report
Section Two
In these models, SCHG is replaced with QQQ in the two Aggressive models. The times spans used are as follows.
- OMFL, QQQ, SCHD, SCHG, SPGP – 2017 to Present
- OMFL, QQQ, SCHD, SCHG, SPGP – 2021 to Present
- OMFL, QQQ, SCHD, SCHG, SPGP – 2022 to Present
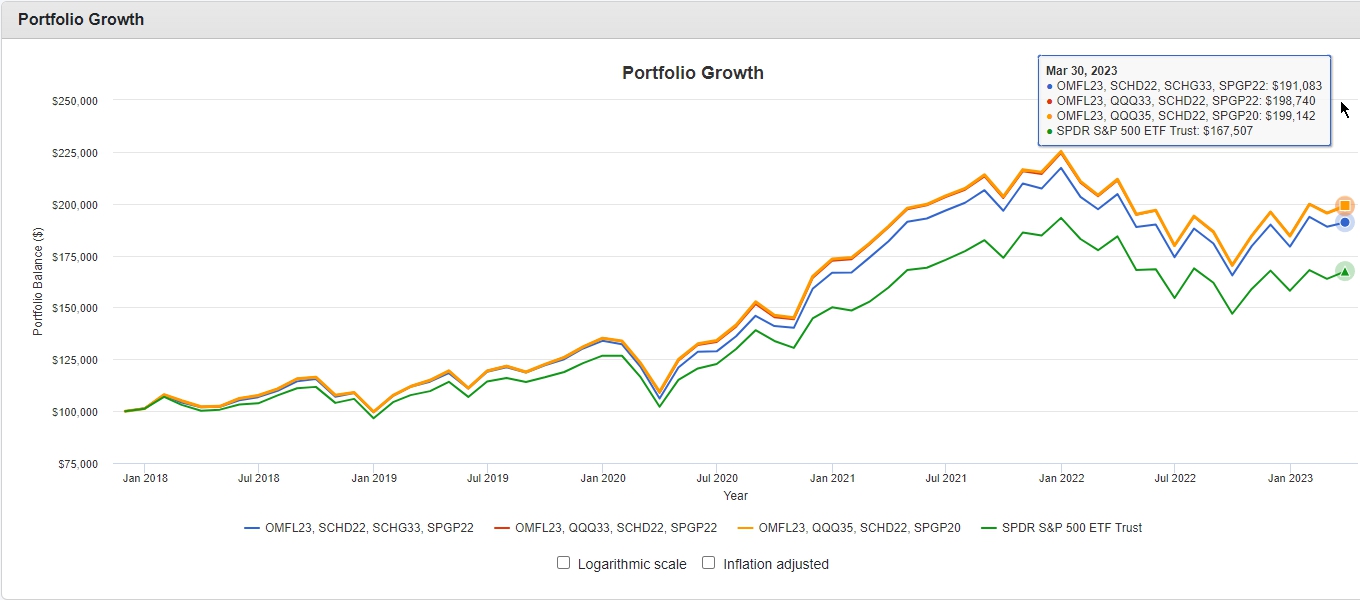
Link to full PDF report
Link to full PDF report
Link to full PDF report
