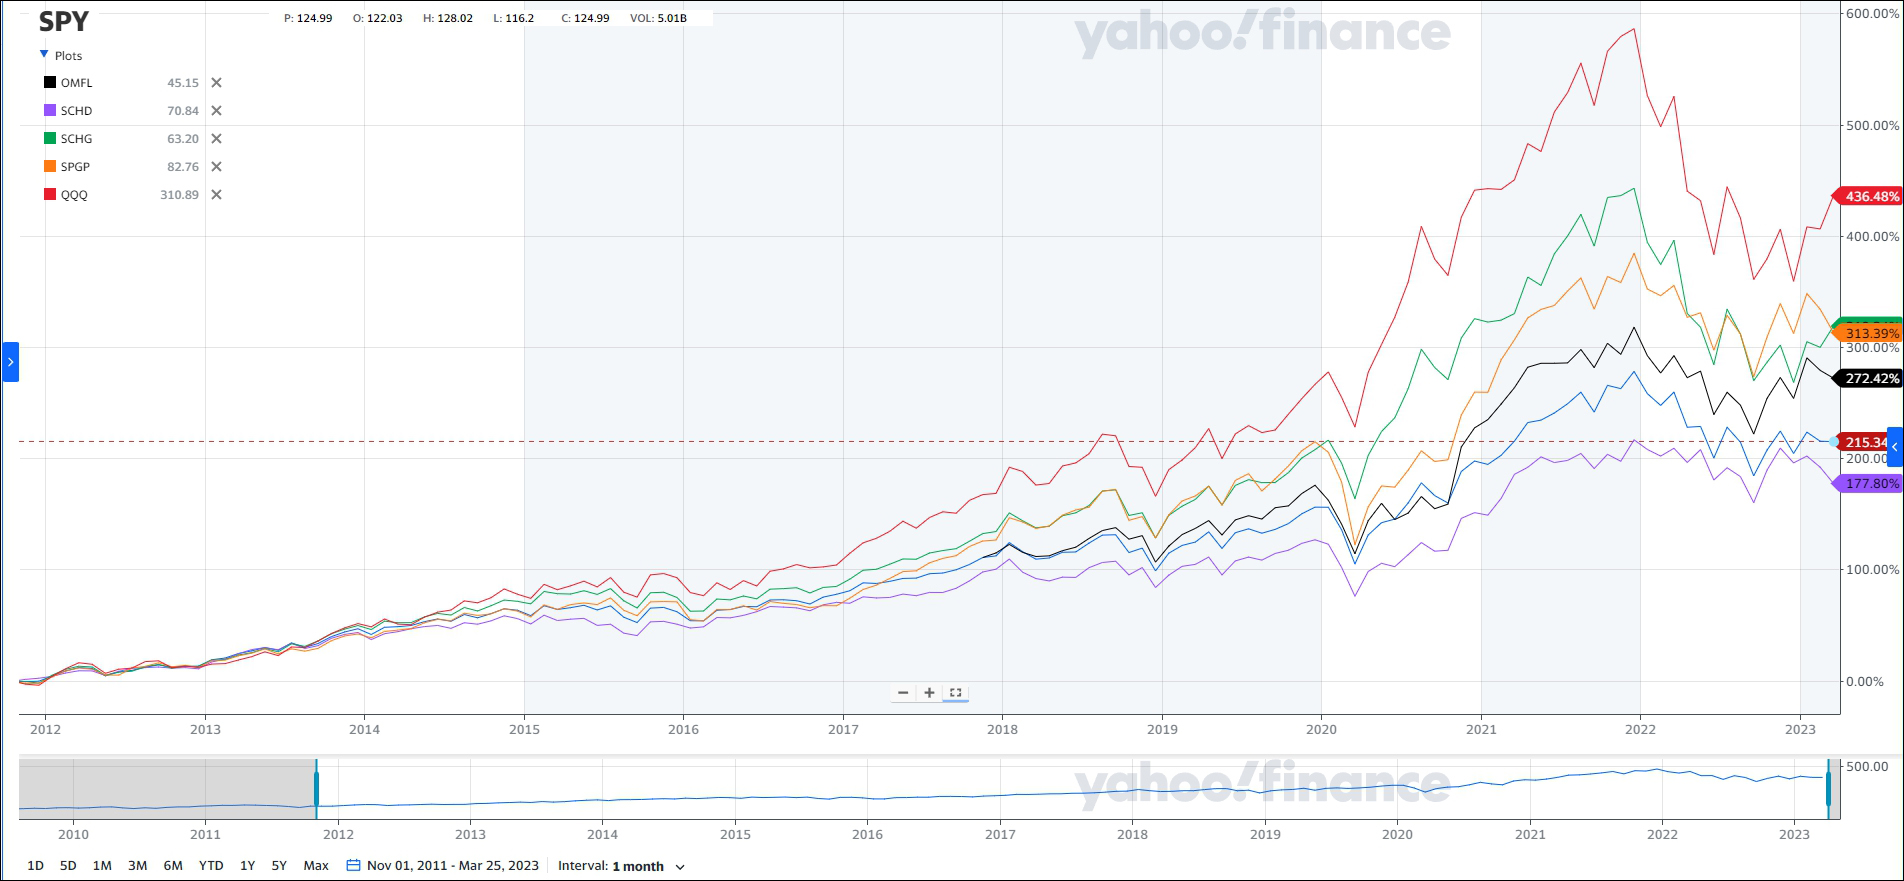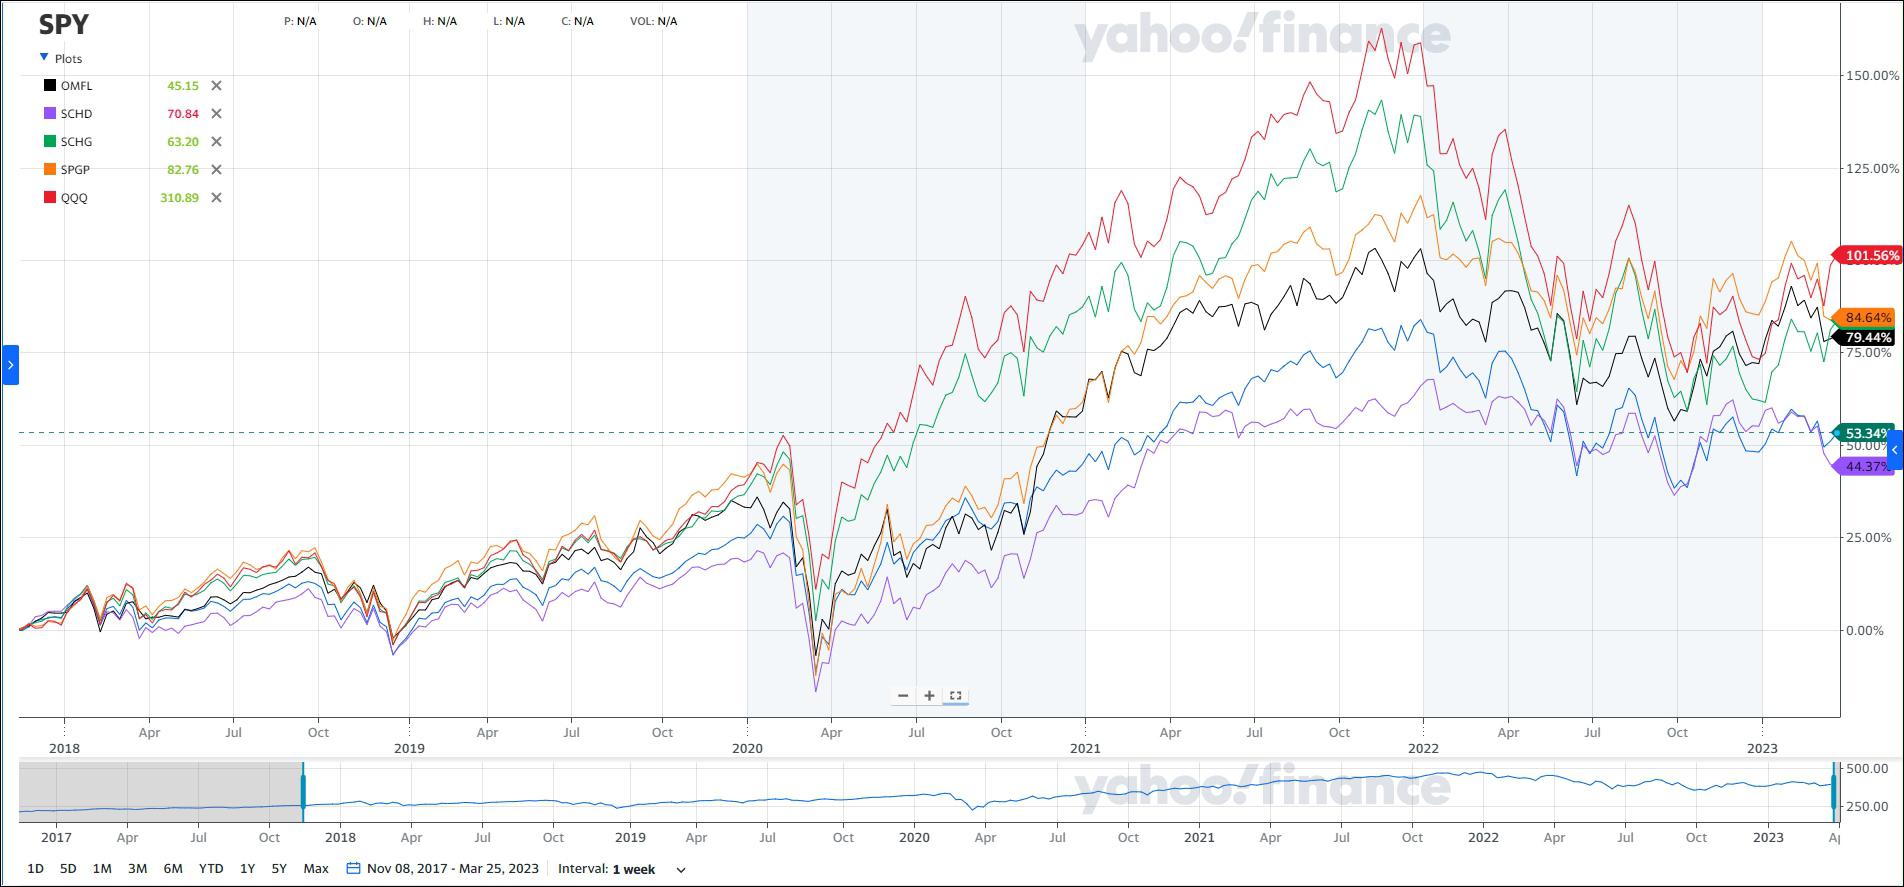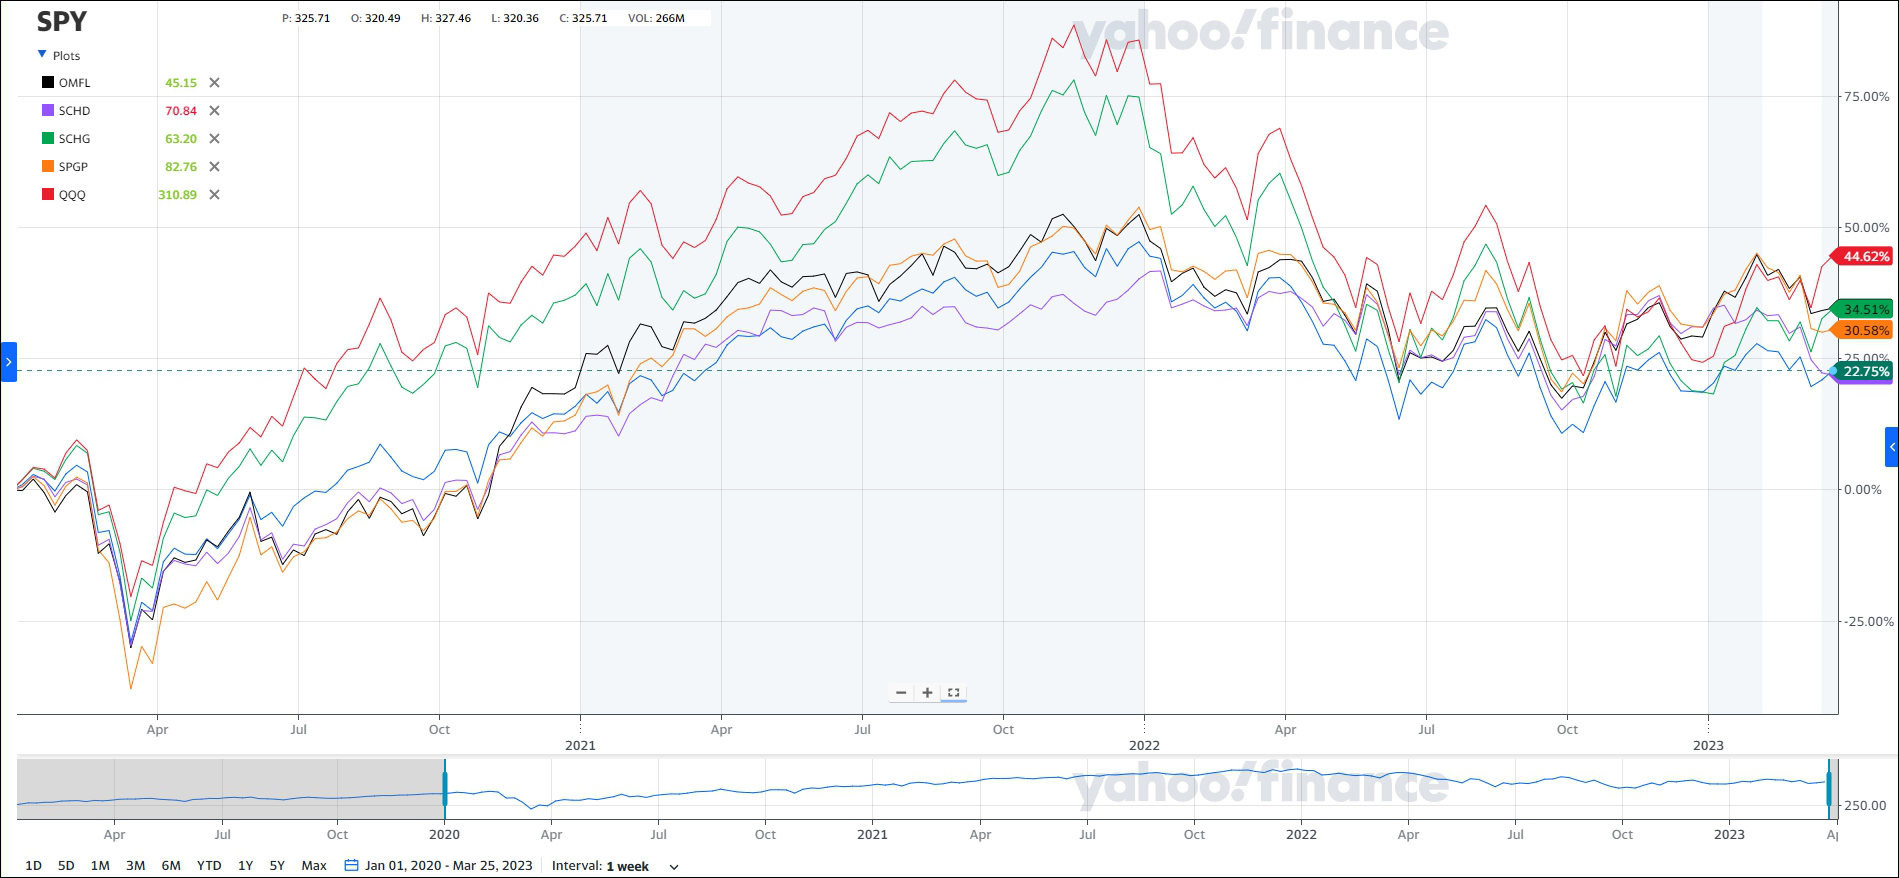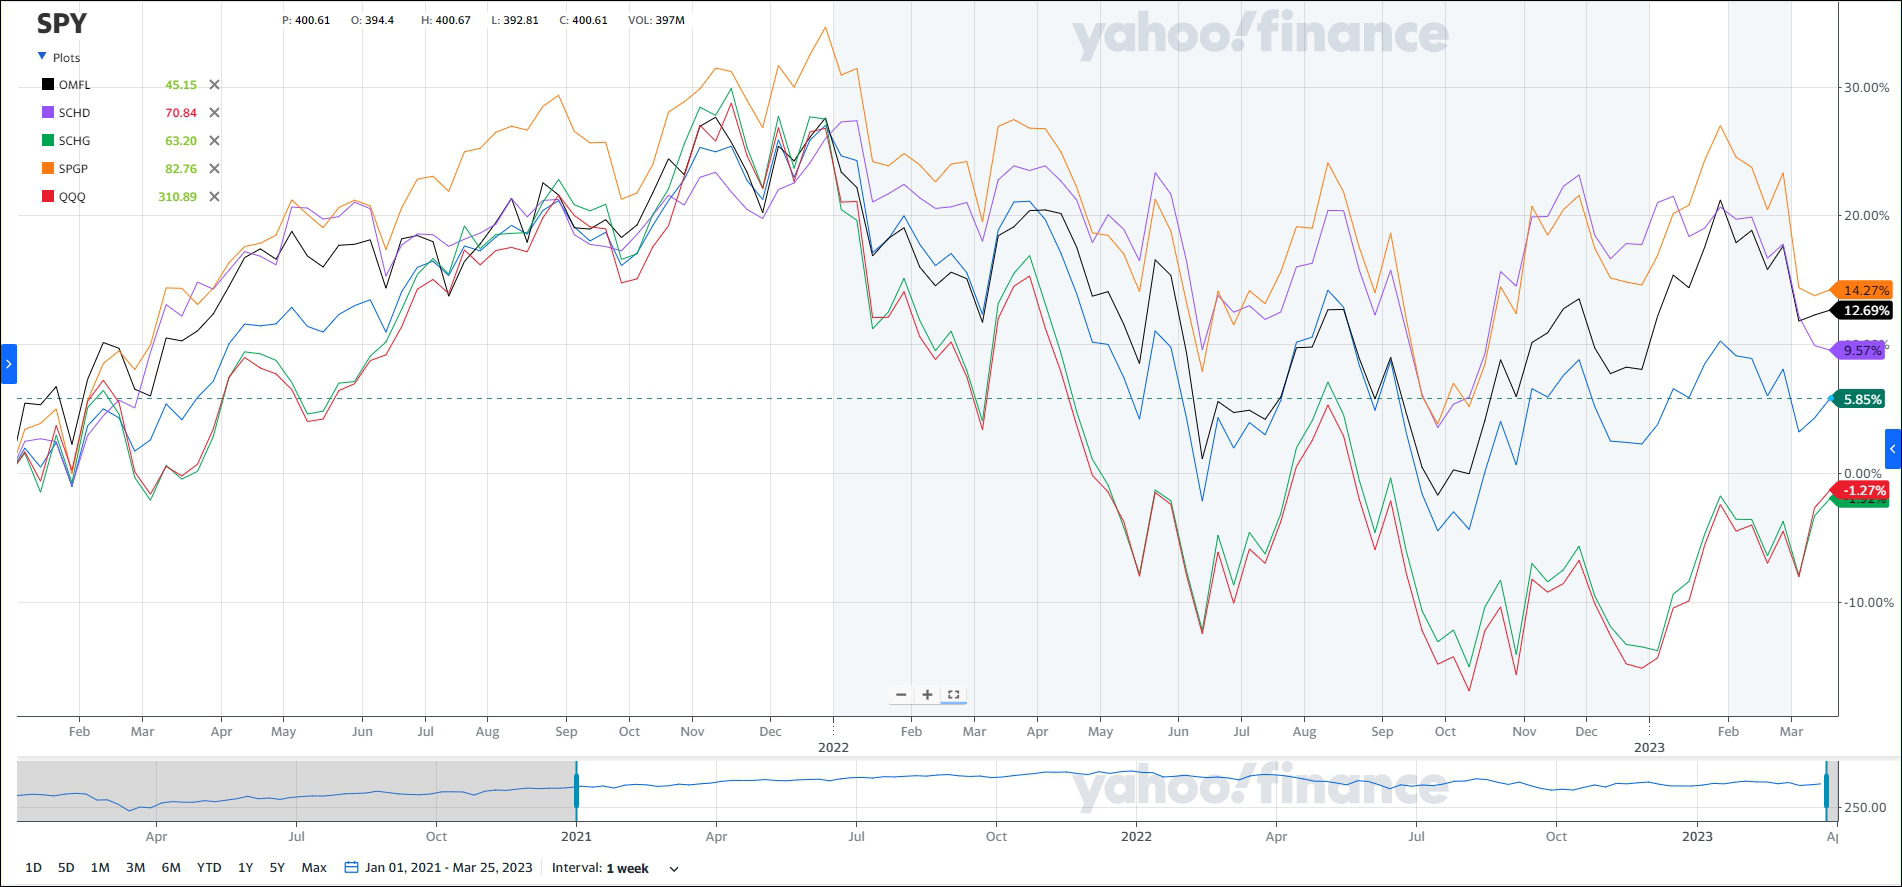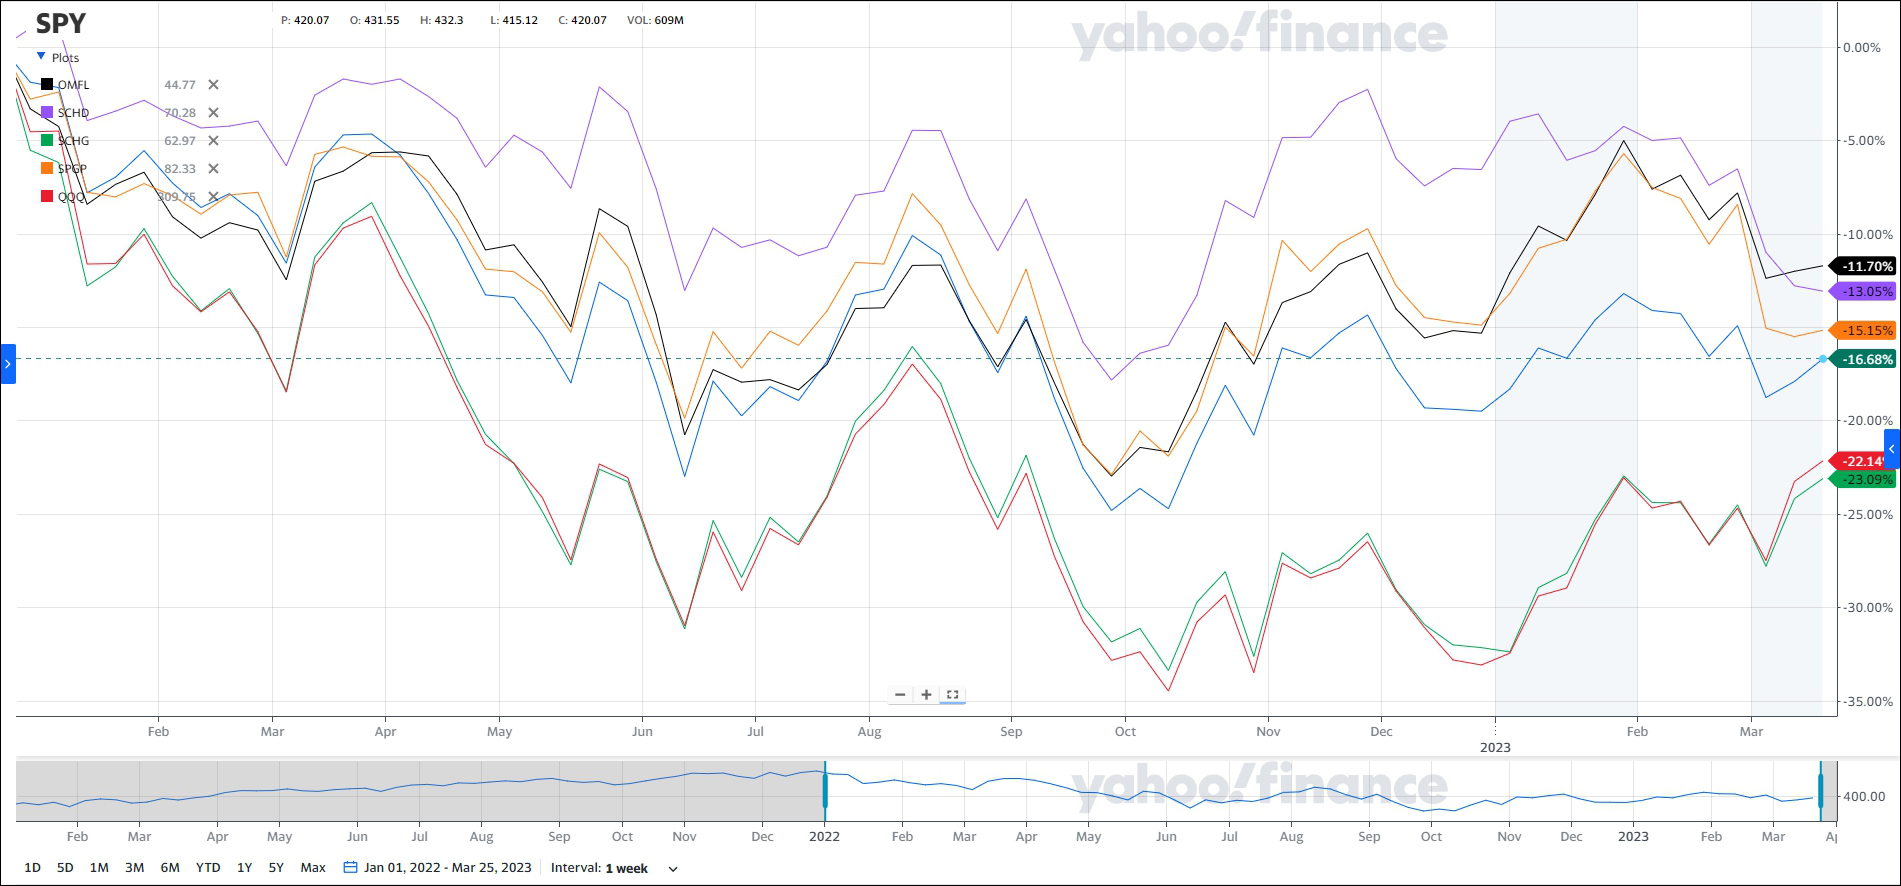
On the following 5 charts SPY (S&P 500) is included for reference, and is colored navy blue. Each chart shows a comparison of OMFL, QQQ, SCHD, SCHG, SPGP, and SPY over a different time frame up to March 24, 2023. The inception date of SPGP and SCHD were June and November of 2011 respectively, so we use November 2011 as the beginning of the longest time frame. OMFL’s inception was November 2017, and so it is not on the chart before that date.
With these charts it is possible to view a regime change starting in 2021 as market momentum decelerates and leads to a bear market. In charts 1, 2, & 3 (2017 – 2020) the two obvious performance leaders are QQQ & SCHG. In the 4th quarter of 2020 they begin to lag and the new market leaders are OMFL, SCHD, & SPGP. These 3 ETFs provide some resilience during the bear market decline, and create a less volatile portfolio
Click on the charts to expand. Click on right/left side of full chart or use keyboard to navigate through the 5 charts.